Learn and Improve Data Visualization Skills
New Year Resolution
I had my first baby during the pandemic last year and it had been difficult to find time to work on my data visualization skills. One of my new year resolutions is to improve my data visualization skills and share my journey as I learn new visualization techniques and tools.
I decided to start by getting involved in a project by Viz for Social Good. With a young baby at home, I had to be intentional with how I allocate my time for this goal. I timeboxed myself to work on the project over 2 weeks.
What is this project about:
Viz for Social Good partners with non-profit organizations to promote social good and to empower them to understand their own data through beautiful and informative data visualization.
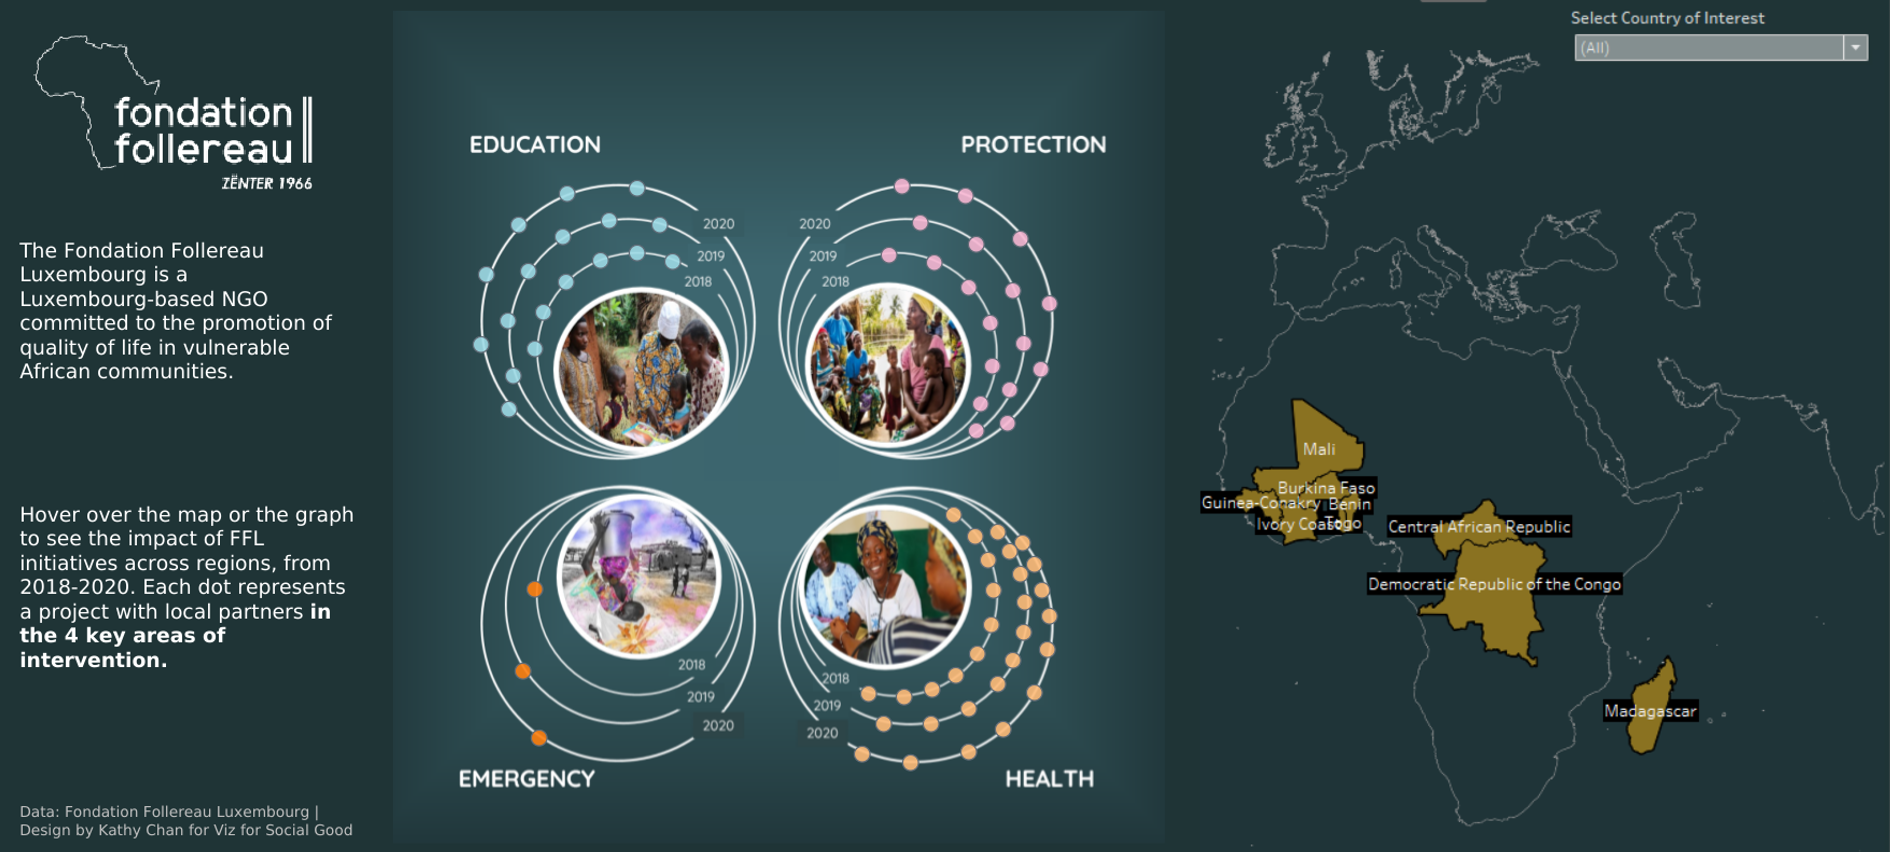
Fondation Follereau Luxembourg (FFL) is a Luxembourg-based NGO is committed to the prevention and promotion of the quality of life of the most vulnerable African communities. The goal of the project is to raise awareness about the intiatives FFL works on, to share the details of their work in different axes of intervention over the past years, and to be able to reach a larger audience to obtain donations that help FFL continue their work.
What is the process:
To start, I reviewed the foundation's website and data to better understand the foundation's mission and goals. I then sketched out and brainstormed different ways to slicing and presenting the data.
I've used standard chart functionalities and formats offered by Tableau, but I wanted to find out if I can create more customized graphs and images to visualize the constellation of work by FFL. I read forums and searched for tutorials to address the different roadblocks along the way. I documented data visualization questions that I bumped into along the way.
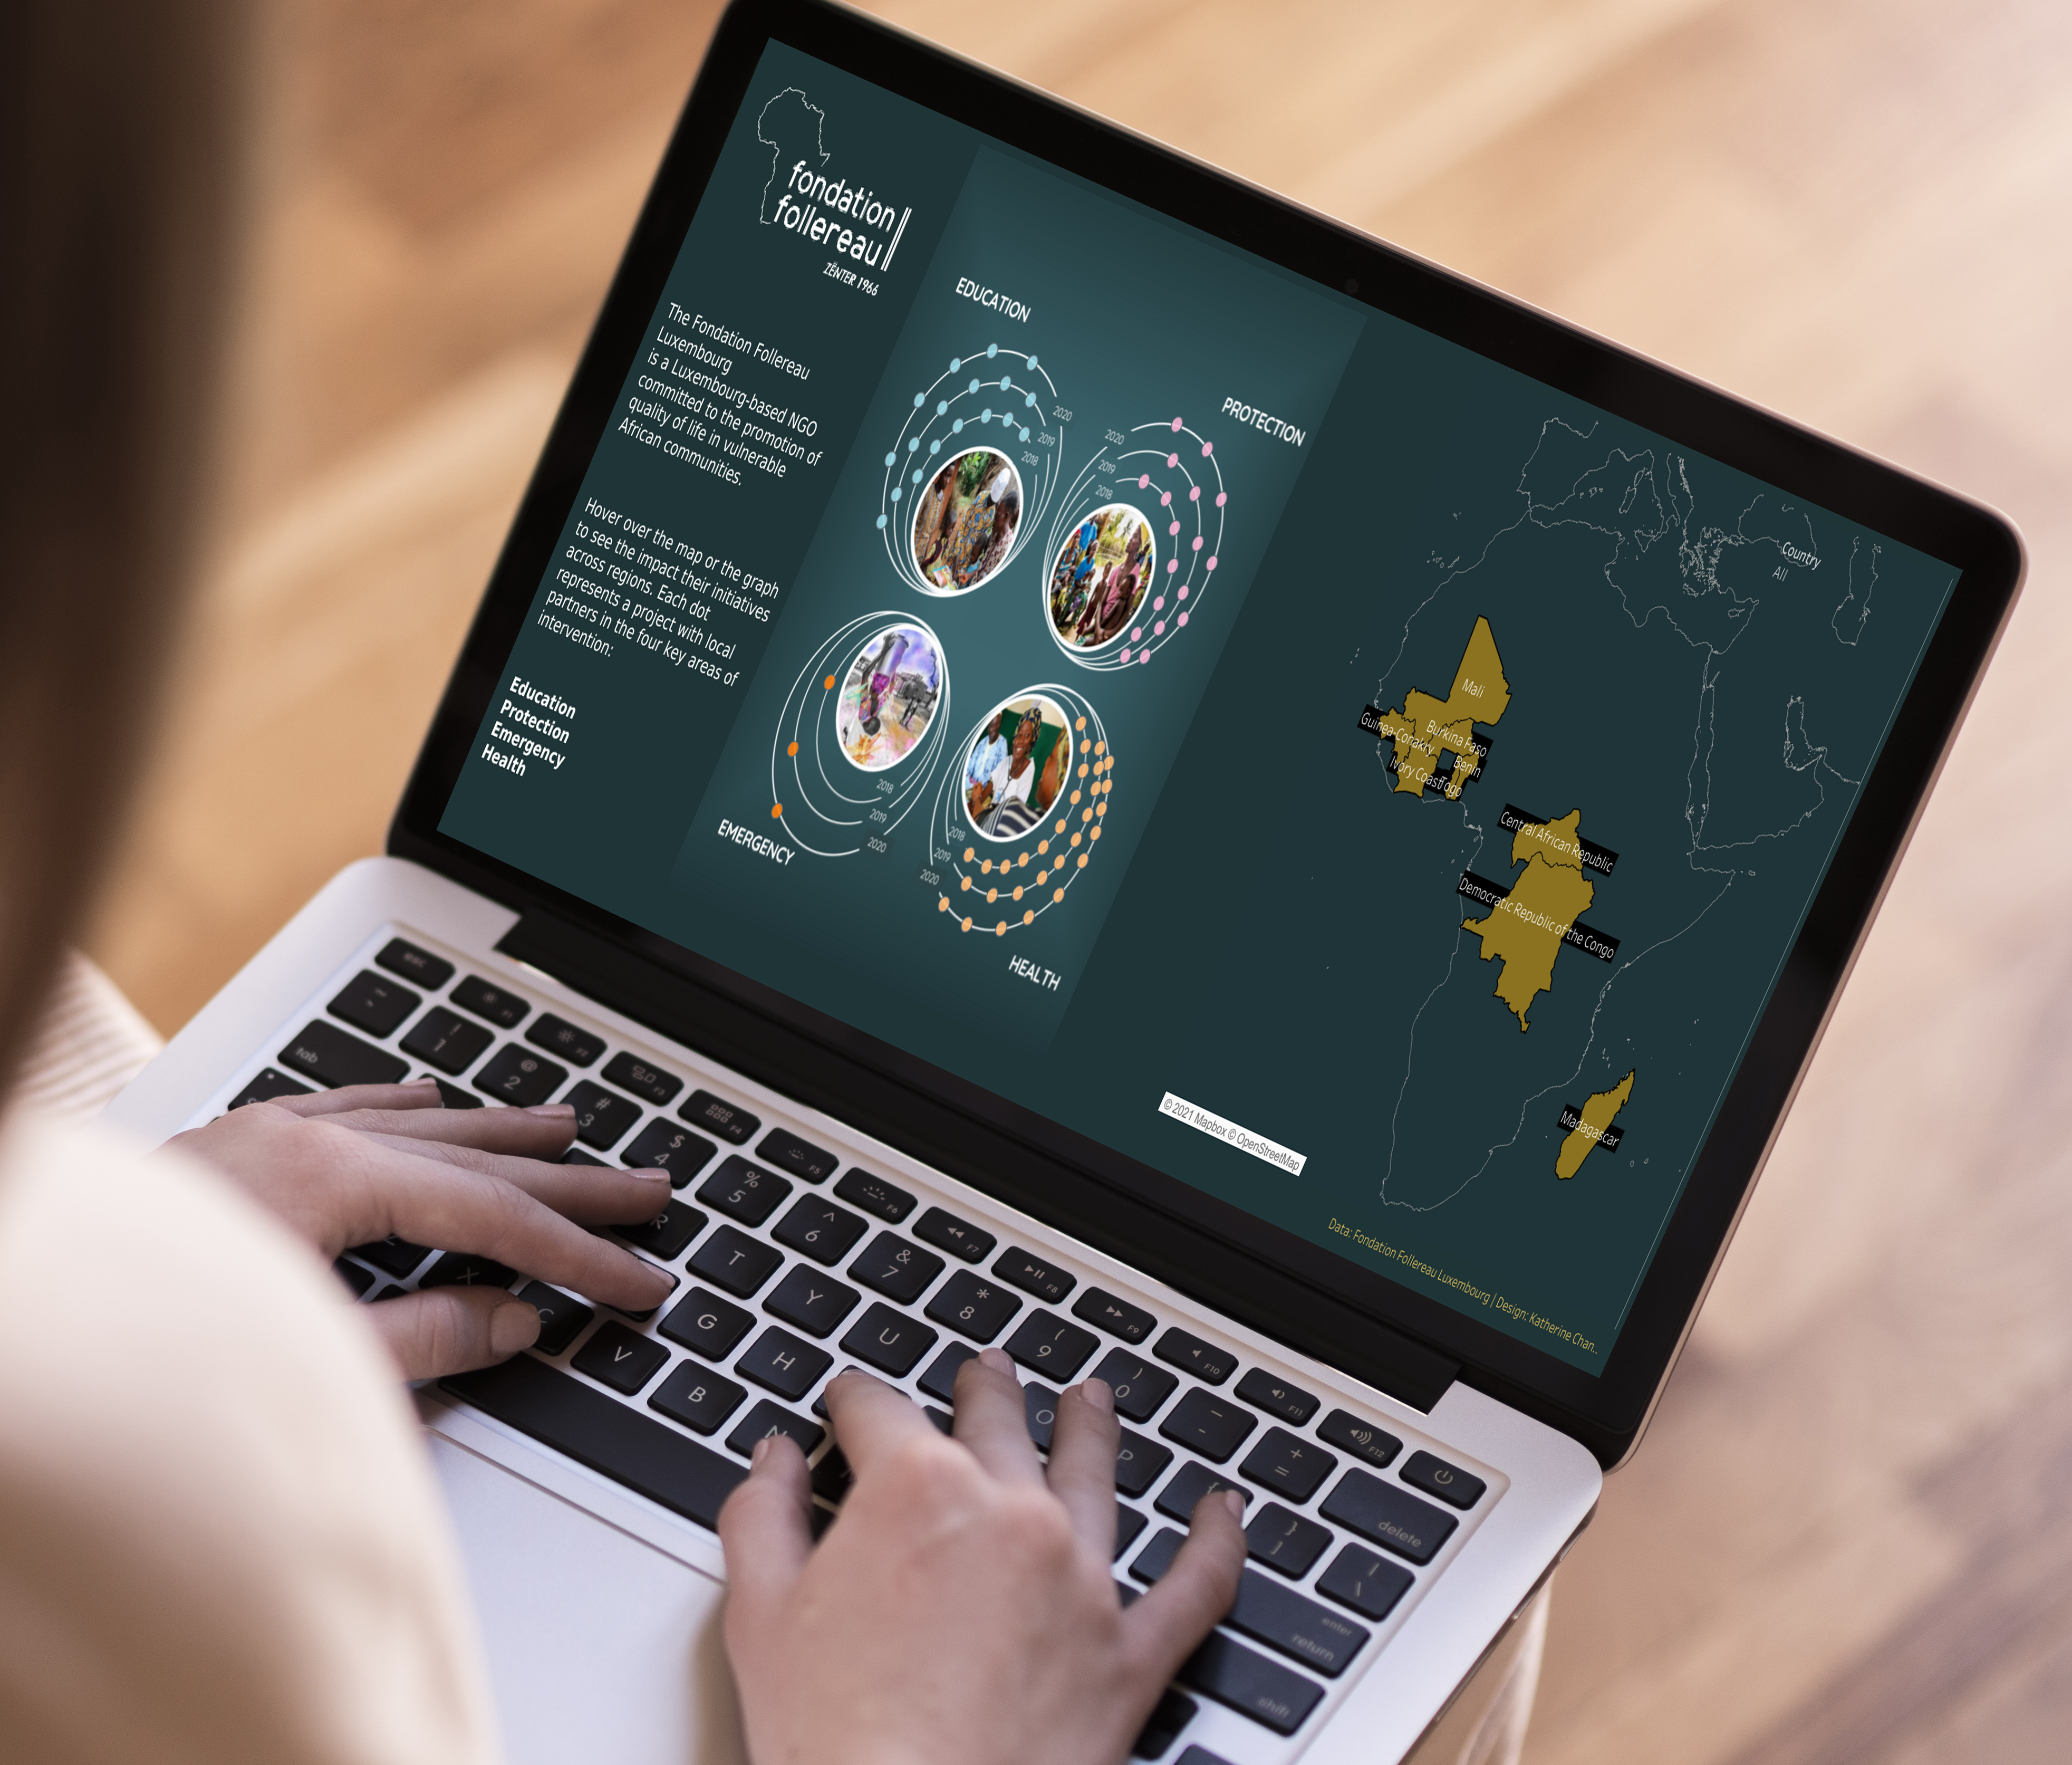
Here is the Viz:
Click HERE to explore interactive viz in Tableau
What I learned
1. How to create my own custom geocode files and mappings using custom background images. This allows me to experiment with different ways data can be presented.
2. How to customize the colour and designs of maps in Tableau to better align with Fondation Follereau Luxembourg
3. How to adjust layout of Tableau for better publishing on Tableau gallery
4. "Don't let perfection be the enemy of progress"